Create an Automated Sales Dashboard with n8n
If you're still pulling numbers from CRMs, spreadsheets, and ad platforms every Monday morning to build a sales report, you're burning time that n8n can handle automatically. A well-built automated sa
If you're still pulling numbers from CRMs, spreadsheets, and ad platforms every Monday morning to build a sales report, you're burning time that n8n can handle automatically. A well-built automated sales dashboard doesn't just save hours — it gives you real-time visibility without the manual assembly. Here's how to build one that actually works.
What You're Actually Building
The goal is a workflow that pulls data from your sales sources on a schedule, transforms it into clean metrics, and pushes everything to a central view — whether that's a Google Sheet, a Notion database, or a custom dashboard tool like Grafana or Retool.
A functional automated sales dashboard typically covers:
- Total revenue by period (daily, weekly, monthly)
- Deal pipeline by stage and owner
- Conversion rates from lead to close
- Revenue by product, region, or channel
- Comparison against targets or previous periods
n8n connects all of this without writing a backend. You define the logic in the workflow editor, and it runs on a cron trigger or webhook — no infrastructure to manage.
Setting Up the Data Sources
Most sales stacks have at least one CRM and one payment processor. n8n has native nodes for the common ones, which means you're not writing custom HTTP requests for basic operations.
Typical integrations for a sales dashboard:
- HubSpot or Pipedrive — deal data, pipeline stages, contact info
- Stripe or Gumroad — actual revenue, refunds, subscription status
- Google Sheets — intermediate storage or final destination for the dashboard
- Slack or email — daily digest delivery without opening a browser
Start with a scheduled trigger — a simple cron node set to run at 06:00 every morning. Then chain your data-pull nodes in sequence or parallel depending on whether the data sources are independent. For HubSpot deals and Stripe payments, you can fetch both simultaneously using parallel branches in n8n, then merge the results before processing.
Transforming and Aggregating the Data
Raw API responses are rarely dashboard-ready. A deal list from HubSpot comes back with dozens of fields you don't need, and revenue from Stripe is in cents with timezone offsets. The transformation step is where n8n's Code node and Function nodes earn their keep.
Key transformations you'll implement:
- Filter deals by close date range (this week, this month)
- Group deals by owner or stage using a reduce function
- Sum revenue and convert from cents to dollars
- Calculate conversion rate: closed-won / total deals created
- Compare current period against previous period for delta indicators
A single Code node with about 30 lines of JavaScript handles most of this. The output is a clean object with exactly the fields your dashboard needs — no extra noise. If you're pushing to Google Sheets, map each field to a column explicitly rather than dumping the whole object; it makes the sheet predictable when the API response shape changes upstream.
Delivering the Dashboard Output
Where the data ends up depends on your team's workflow. Three patterns work well in practice:
- Google Sheets live dashboard — update a dedicated "Dashboard" tab with the latest metrics on every run. Add conditional formatting in Sheets for instant red/green indicators. No extra tools required.
- Slack digest — format a message with the key numbers and post it to a #sales channel every morning. The team sees it without logging into anything.
- Webhook to a frontend — if you have a Retool or custom React dashboard, POST the aggregated data to a webhook and let the frontend render it. n8n becomes the data layer, not the display layer.
For most small teams, the Google Sheets approach gets you 90% of the value with the least friction. You get a live, shareable view with zero additional infrastructure.
Error Handling and Reliability
A dashboard that silently fails is worse than no dashboard — you'll trust stale numbers. Add an error workflow in n8n that fires when any node fails and sends a Slack message or email with the node name and error. It takes five minutes to set up and saves you from discovering a broken pipeline three days later.
Also version-pin your external API calls where possible. HubSpot and Stripe both version their APIs, and breaking changes without notice are rare but not impossible. If your workflow breaks after an n8n update, check the node changelog first — community nodes especially can have breaking releases.
Building this from scratch takes a few hours if you're comfortable with n8n. If you want to skip the setup and get straight to a working pipeline, there are ready-made n8n templates for sales dashboard automation that are pre-wired for HubSpot, Pipedrive, Stripe, and Google Sheets — download, add your credentials, and the workflow runs. Either way, the Monday morning manual report is a problem you can eliminate this week.
Ja construimos isso pra voce
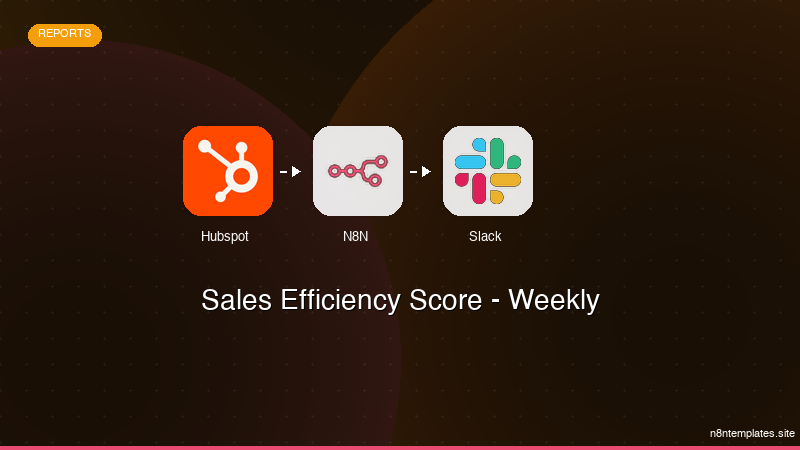
Nao comece do zero. O Sales Efficiency Score - Weekly e um workflow n8n pronto para instalar que faz exatamente isso — em minutos, nao horas.
Instalar por $59 →