
Build a Revenue Dashboard That Updates Itself with n8n
Most revenue dashboards lie to you — not because the data is wrong, but because it's old. You pull numbers manually, paste them into a spreadsheet, and by the time you share it, reality has already mo

Most revenue dashboards lie to you — not because the data is wrong, but because it's old. You pull numbers manually, paste them into a spreadsheet, and by the time you share it, reality has already moved. A self-updating revenue dashboard eliminates that lag entirely. With n8n, you can wire your actual revenue sources together and have a live view that refreshes itself without anyone touching it.
What a Self-Updating Revenue Dashboard Actually Means
A self-updating dashboard is not a fancy chart. It is an automated pipeline that pulls data from your revenue sources on a schedule, transforms it into a consistent format, and writes it somewhere you can see — a Google Sheet, a Notion database, a Grafana panel, or a simple HTML page on your server.
The dashboard itself is almost irrelevant. The hard part is the pipeline. You need to answer three questions before building anything:
- Where does revenue actually originate? (Stripe, Gumroad, Shopify, PayPal — pick all that apply)
- What is the single source of truth you want to write to?
- How fresh does the data need to be — hourly, daily, on every transaction?
Once you have those answers, n8n gives you the infrastructure to make it happen with zero custom backend code.
Building the Pipeline in n8n
The architecture is straightforward. A Schedule Trigger node fires at your chosen interval — every hour works for most businesses. From there, you branch into parallel HTTP Request nodes, one per revenue source. Each branch fetches the data you need: total sales, transaction count, refunds, net revenue.
The critical step most people skip is normalization. Each platform returns data in a different shape. Stripe gives you amounts in cents with Unix timestamps. Gumroad gives you dollars with ISO dates. Before you write anything to your dashboard, run each payload through a Code node or a Set node that converts everything to the same structure:
- Amount always in dollars, always a float
- Date always in UTC, always ISO 8601
- Source always a string identifier like
stripeorgumroad - Type always
saleorrefund
After normalization, a Merge node combines all sources into a single array. From there, you aggregate — sum by day, by source, by product — and write the result to your destination with a Google Sheets node, an HTTP Request to your own API, or a direct database write via the Postgres or MySQL node.
Handling Webhooks for Real-Time Updates
If hourly refresh is not fast enough, most payment platforms support webhooks. You can run two parallel strategies in the same n8n instance: a scheduled job for full historical reconciliation and a webhook listener for immediate updates on new transactions.
In n8n, add a Webhook node as a second trigger. Point your Stripe or Gumroad webhook URL at it. When a payment lands, the workflow fires immediately, processes just that single transaction, and appends it to your dashboard without waiting for the next scheduled run.
The key is idempotency — make sure your write logic handles duplicate events. If the scheduled job and a webhook fire within the same window, you do not want the same sale counted twice. A simple check in a Code node — look up the transaction ID before writing — is enough to prevent that.
Connecting the Output to Something Visible
Where you display the data depends on your workflow. Three practical options:
- Google Sheets: Use the Google Sheets node to write to a named range. Connect Looker Studio for free charting. Shareable with the entire team in minutes.
- Notion: Use the Notion node to update a database. Build a gallery or table view. Works well for operators who already live in Notion.
- Custom endpoint: Have n8n POST the aggregated JSON to a lightweight server. A single-page HTML file with Chart.js reads from that endpoint and renders the chart client-side. Full control, no third-party dependency.
For most small business operators, Google Sheets is the fastest path to something useful. You have the data model working in n8n in under two hours, and Looker Studio handles the visualization for free.
If you want to skip the build entirely and start with a working foundation, ready-made n8n templates give you pre-built workflows for Gumroad, Stripe, and Google Sheets integration that you can deploy and customize in minutes rather than building from scratch.
What to Track Beyond Total Revenue
Total revenue is the headline number, but a useful dashboard tracks the metrics that explain it:
- Net revenue after refunds: Gross minus refunds. This is the number that actually matters for cash flow.
- Transaction count: If revenue is flat but transaction count drops, average order value is up — that is a different situation than more buyers spending less.
- Revenue by source: When you sell on multiple platforms, knowing which channel is driving growth tells you where to focus.
- Day-over-day and week-over-week delta: Absolute numbers without context are noise. The trend is the signal.
Add these as computed columns in your normalization step. They cost almost nothing extra to calculate and make the dashboard dramatically more useful for actual decisions.
A self-updating revenue dashboard built on n8n takes one afternoon to set up properly. Once it is running, you stop asking "what are the numbers?" and start asking "why did the numbers change?" — which is a much more productive question for a business operator to be spending time on.
Ja construimos isso pra voce
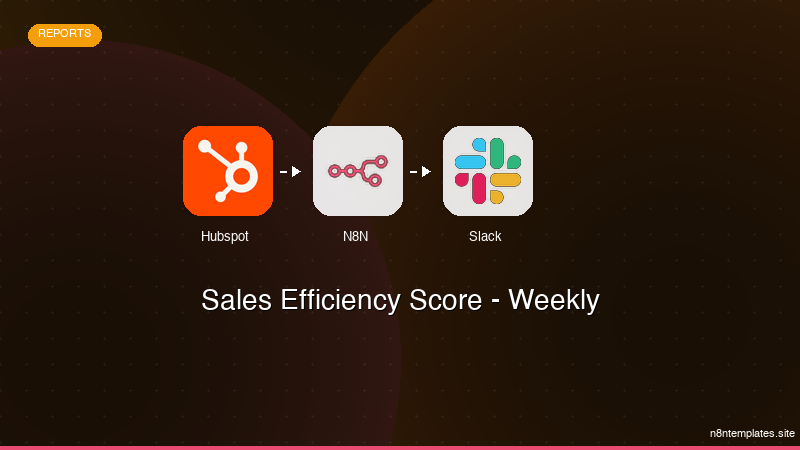
Nao comece do zero. O Sales Efficiency Score - Weekly e um workflow n8n pronto para instalar que faz exatamente isso — em minutos, nao horas.
Instalar por $59 →

